The American Surveyor
Latest News
04.25.2024
Topcon Announces Plans for New State-Of-The-Art Manufacturing Facility in Germany
04.24.2024
Descartes Labs Government Launches Retina at GEOINT 2024
04.24.2024
DOL’s Overtime Salary Level Threshold Increase Will Harm Small Businesses, Says ABC
04.24.2024
ABC Denounces FTC’s Blanket Ban on Noncompete Clauses
04.23.2024
The Release of UgCS 5.0 is Setting New Standards in Drone Flight Planning
04.18.2024
Common Ground Alliance Hosts Conference & Expo in Colorado on Preventing Utility Damages
04.18.2024
Virtual Surveyor Adds Planimetric Survey Functionality to Latest Release of Smart Drone Surveying Software
04.17.2024
7 Things to See at GEO Business
04.15.2024
In Passing: Dale Beeks (1951 – 2023)
04.15.2024
Point One Delivers the First Highly Accurate and Easy-to-Use Precision Platform for Surveyors and Surveying Tool Manufacturers
04.11.2024
Strategic Agreements Integrate Topcon Technology Into Solutions from Bentley Systems and Worldsensing
04.08.2024
Space Flight Laboratory Confirms Successful Deployment of HawkEye 360 Microsatellite Clusters 8 and 9
04.08.2024
Septentrio mosaic GPS/GNSS Now Also Available in MIKROE Click Board Ecosystem
04.08.2024
INTERGEO: Meeting Place for the Global Geospatial Community
04.05.2024
Live Workshop: Obliques for Mapping: Are They Really Useful?
04.02.2024
Avineon Completes Acquisition of North Point Geographic Solutions
03.29.2024
ABC: Final OSHA Worker Walkaround Rule Is Bad Policy, Does Not Prioritize Workplace Safety
03.29.2024
Hancock Associates Announces Retirement of John Noonan, P.E., P.L.S.
03.28.2024
Survey Reveals 26.9 Million Americans Plan to Dig Without Contacting 811 First
03.28.2024
ABC Files Lawsuit Against President Biden’s Anti-Competitive Project Labor Agreement Rule for Federal Construction Projects
03.27.2024
Commercial UAV Expo Announces 2024 Advisory Board
03.26.2024
Geneq Unveils the SXblue GLOBE
03.19.2024
Emlid Celebrates its 10th Anniversary
03.18.2024
Trimble and Radiodetection Combine Survey-Grade Positioning with Underground Utilities Locating Measurement Workflows
View All News »
Features
Latest Issue
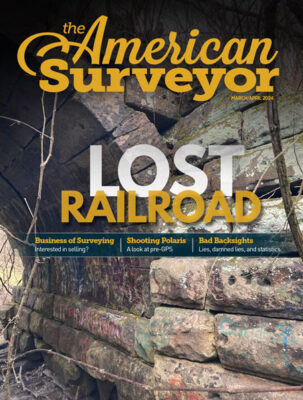
Volume 21 Issue 1 // March 2024
Departments
The Business of Surveying
The Business of Surveying: There’s a New Buyer in Town—Are You Ready?
This article kicks off a new series, Business of Surveying, by Rich Radke, a seasoned business advisor with expertise in advising companies across…
Guest Editorial
Guest Editorial: Don’t Be a Button Pusher
“Hey! My best friend’s uncle’s neighbor’s brother-in-law was a surveyor!” Any surveyor who has spent any time in the field has heard a…
Bad Backsights
Bad Backsights: Spring Interrogatory
There are always more questions than answers. This seems to be a universal law and it certainly holds true in my experience. Every…
Vantage Point
Vantage Point: Read the Deed!
When my husband and I sat down to sign closing papers to buy our current house, I asked to see the deed before…